


-
Industries
Healthcare & Compliance
Patient data systems, compliance reporting, and workflow automation for regulated environments.
- HIPAA-aware integration pipelines
- Automated compliance dashboards
- Patient workflow digitization
Logistics & Supply Chain
Real-time tracking, route optimization, and inventory visibility across your distribution network.
- ERP/WMS integration
- Automated dispatch workflows
- Supply chain dashboards
SaaS & Tech-enabled
Scale your product infrastructure, integrate third-party tools, and ship features faster with reliable ops.
- API-first architecture
- Multi-tenant infrastructure
- CI/CD and release pipelines
Banking & Financial
Secure transaction processing, regulatory reporting, and customer-facing portals for financial services.
- Regulatory reporting automation
- Secure data integration
- Customer portal modernization
- Case Studies
Featured Case Studies
Browse all case studies →Euro Truck ServiceLogistics firm automated 12 manual workflows in a single 30-day sprint
"Read case study →Ergonnex AI 360Ergonnex AI 360 is a powerful project management platform that helps IT companies manage their projects better with built-in AI-powered analytics
Read case study →PanoramikPanoramic caters to your passion for sharing photos in a social media environment.
Read case study →

What is Microsoft Power BI?
![]() Power BI, developed by Microsoft, stands out as a powerful business analytics tool tailored for modern enterprises. With Power BI solutions, users benefit from interactive visualizations and robust business intelligence capabilities through an intuitive interface for creating reports and dashboards.
Power BI, developed by Microsoft, stands out as a powerful business analytics tool tailored for modern enterprises. With Power BI solutions, users benefit from interactive visualizations and robust business intelligence capabilities through an intuitive interface for creating reports and dashboards.
For e-commerce businesses, Power BI offers significant advantages:
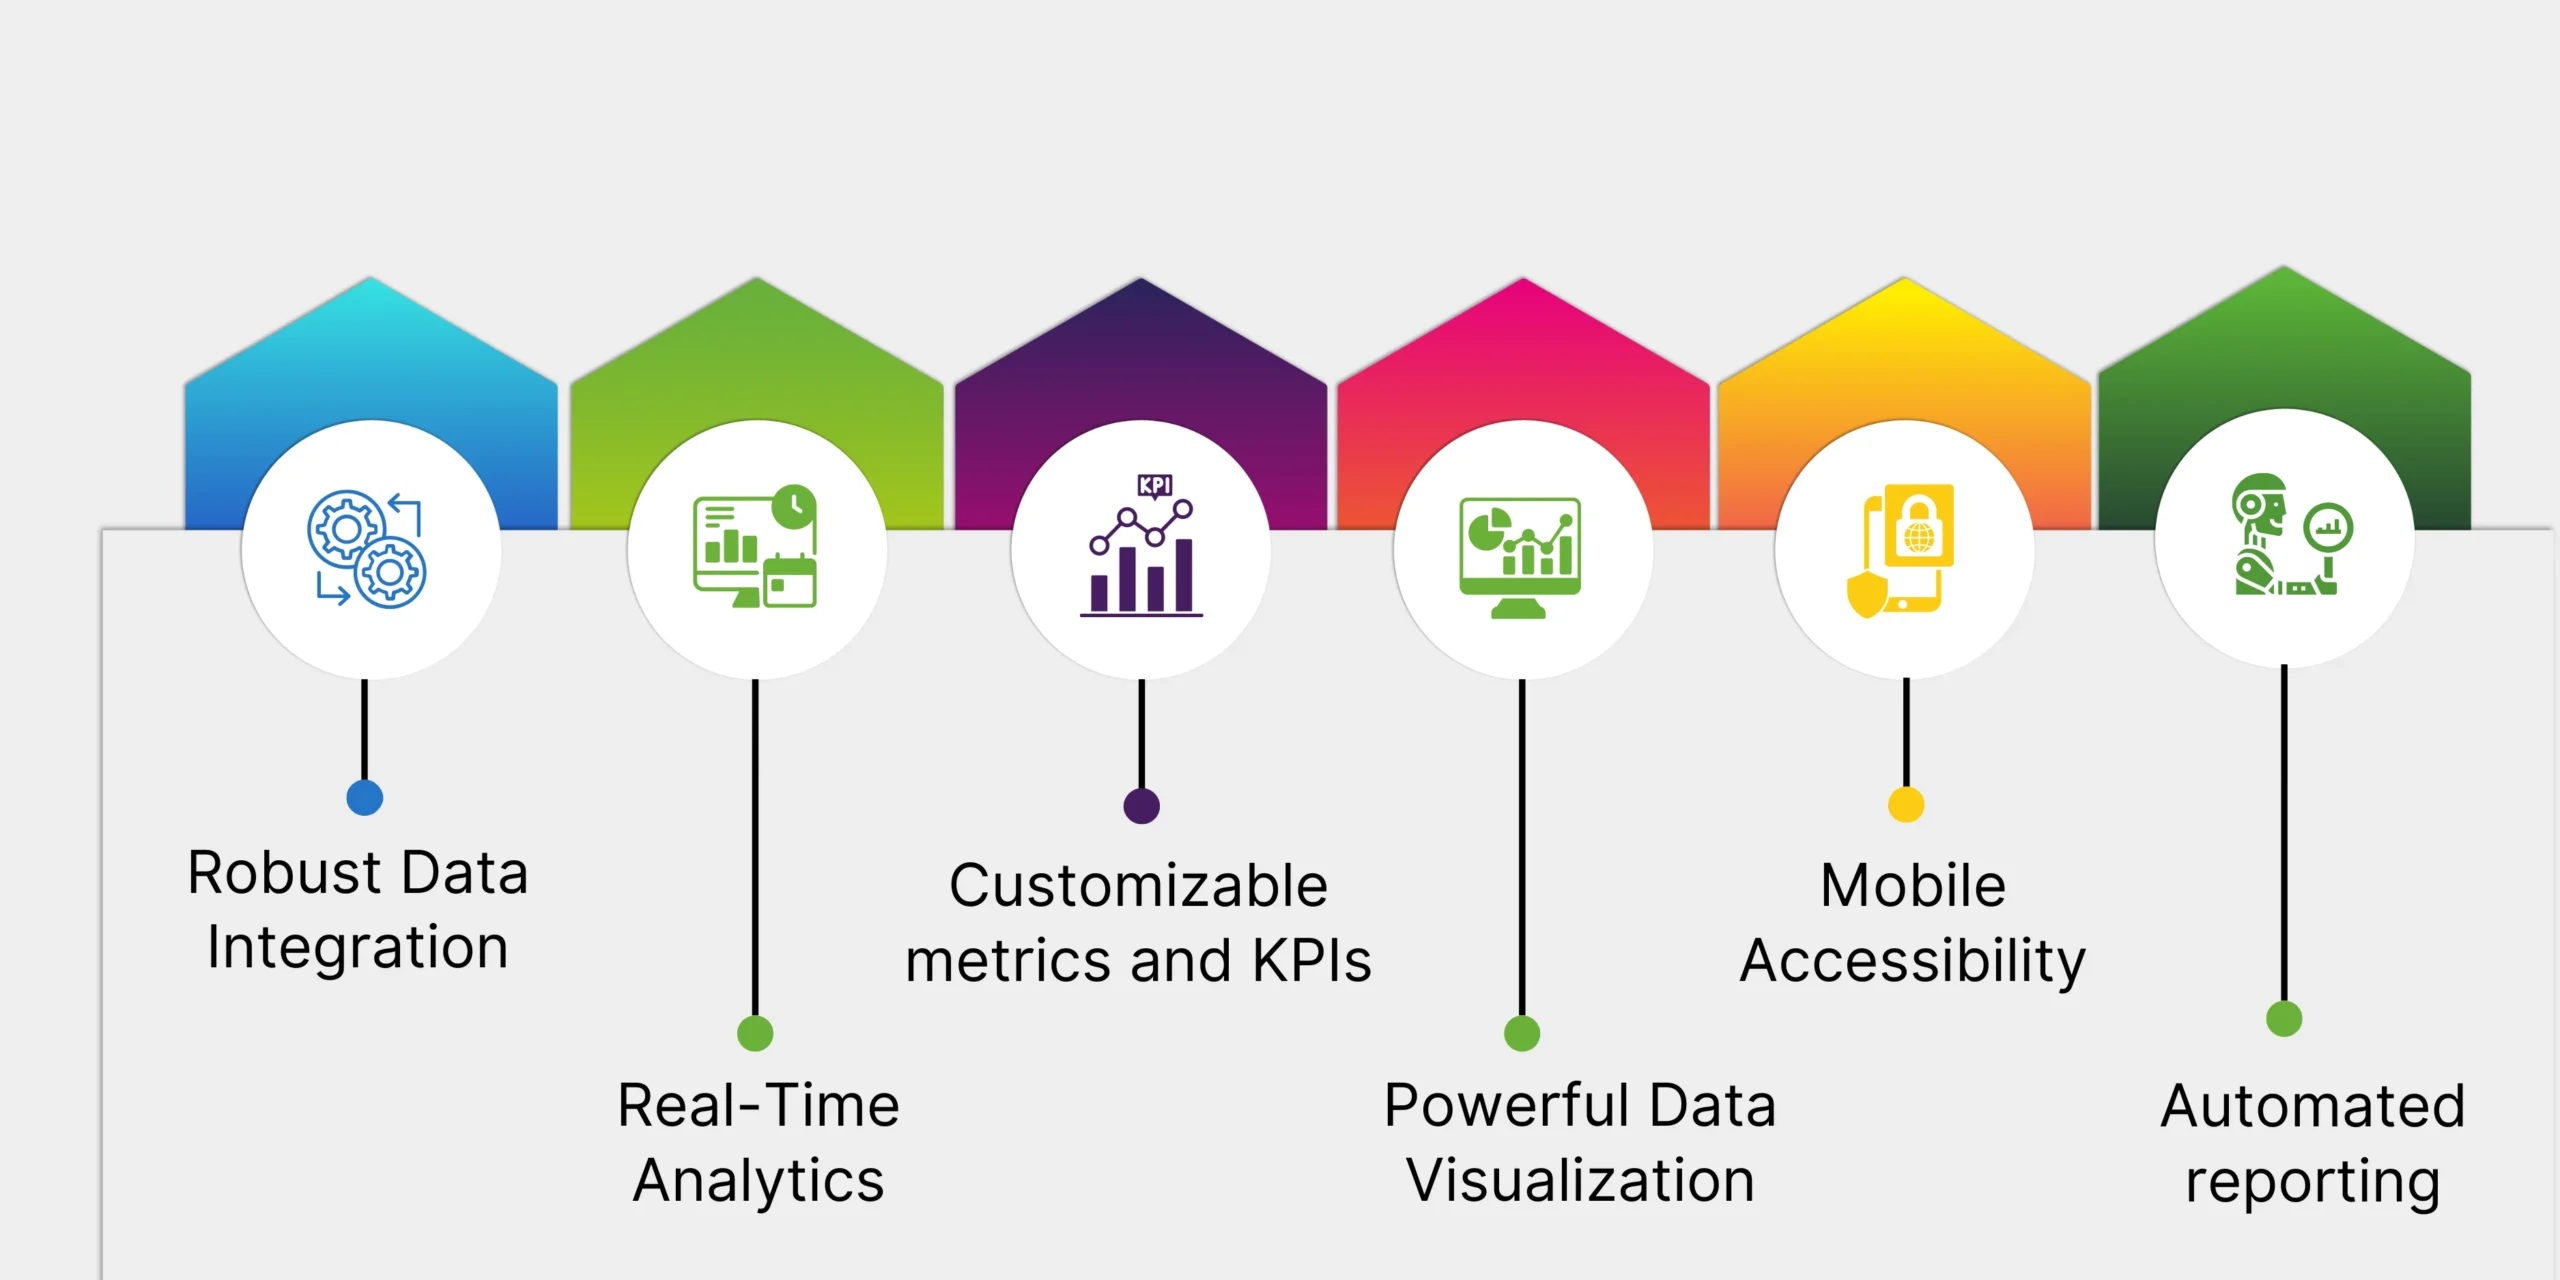
Robust Data Integration: Businesses can seamlessly integrate data from various sources, ensuring a unified view of operations.
Real-Time Analytics: Essential for monitoring dynamic metrics such as sales and inventory, providing timely insights for decision-making.
Customizable metrics and KPIs: Power BI enables users to set up measurements and Key Performance Indicators (KPIs) in accordance with their own requirements, acknowledging that every business has different demands and goals. Businesses may concentrate on the most crucial data because of this flexibility, which boosts productivity and produces better outcomes.
Powerful Data Visualization: Simplifies complex data into understandable visuals, aiding in quick analysis and actionable insights.
Mobile Accessibility: Its mobile-friendly interface enables users to access and interact with data on-the-go, enhancing flexibility and responsiveness.
Automated reporting: Power BI’s automated reporting function eliminates the need for manual report production, saving a significant amount of time and money. It ensures that reports are produced and sent out promptly, providing immediate information about inventory performance and supporting quicker decision-making. The Power BI inventory dashboard plays a crucial role in this process by offering a comprehensive, real-time view of inventory data, further enhancing efficiency and accuracy.
Benefits of Power BI for E-commerce Inventory Management
Power BI, developed by Microsoft, has transformed the e-commerce sector, particularly in inventory management. It offers intuitive visualizations and powerful business intelligence tools for creating reports and dashboards.
Creating an Effective Inventory Dashboard with Power BI
Power BI inventory dashboard provides a comprehensive real-time view of your inventory, aiding informed decisions on stock levels, sales forecasts, and procurement strategies. Here’s how Power BI facilitates the creation of a valuable inventory dashboard:
Data Integration: Power BI consolidates data from various sources, such as your e-commerce platform, ERP system, CRM, and other databases, providing a unified inventory view across all channels.
Data Transformation: Power BI includes tools for cleaning, organizing, and shaping data to suit specific needs, particularly useful for managing extensive and intricate inventory data.
Interactive Visualizations: With Power BI, you can generate interactive charts, graphs, and maps to visually interpret inventory data, enabling quick trend identification, issue pinpointing, and a clear understanding of inventory status.
Enhancing inventory efficiency with Power BI
Power BI stands as a robust business analytics tool, equipped with features that streamline and elevate how businesses handle inventory. Here’s how it delivers value:
Predictive Analytics: Power BI’s predictive analytics accurately anticipate demand trends, enabling proactive inventory management to prevent stock shortages or overstocking.
Monitoring Inventory Dynamics: Businesses leverage Power BI to monitor real-time inventory movements, distinguishing fast-selling items from slower movers. This insight empowers informed decisions to prioritize popular products and adjust inventory levels accordingly.
Optimizing Stock Levels: Power BI provides live inventory data, empowering businesses to maintain optimal stock levels. This capability helps minimize storage costs while meeting customer demand effectively.
Power BI allows businesses with actionable insights to enhance inventory efficiency, reduce operational costs, and elevate overall performance in today’s competitive e-commerce environment.
Boosting Profitability through Power BI Insights
Power BI sales dashboards can significantly enhance profitability. Power BI, a comprehensive business intelligence tool, offers a wealth of actionable insights that guide strategic decision-making and improve financial outcomes. Here are some specific examples:
Analyzing Sales Trends: Power BI allows businesses to track and analyze sales trends over various periods. This feature highlights which products or services are excelling and which need more focus. By understanding these patterns, businesses can adjust their strategies to increase sales and boost profits.
Understanding Customer Purchasing Patterns: Power BI reveals customer buying behaviors, identifying popular products, peak sales periods, and other crucial data. With this information, businesses can refine their product offerings and marketing strategies to align better with customer preferences, driving higher sales and profitability.
Conducting Profit Margin Analysis: Power BI provides detailed profit margin analysis, pinpointing which products or services are the most profitable and which are more expensive to produce. This insight helps businesses make informed decisions about resource allocation to maximize profits.
Steps to implement Power BI for inventory management

Power BI’s automated reporting function eliminates the need for manual report production, saving a significant amount of time and money. It makes sure that reports are produced and sent out promptly, giving immediate information about inventory performance and supporting quicker decision-making.
Recognizing Business Needs:
The first stage is to comprehend the e-commerce company’s unique inventory management requirements in detail. This entails determining critical metrics and Key Performance Indicators (KPIs), understanding the data source, and precisely articulating the Power BI use cases. Engaging a Microsoft Power BI consultant and speaking with a variety of stakeholders is essential to ensuring that all requirements are met. The foundation for a good Power BI configuration is laid in this stage.
Data Integration:
Using Power BI, the next stage is to combine several data sources. Data from the e-commerce platform, inventory control systems, CRM systems, and other pertinent databases may be included in this. The goal is to compile all the required data into a single data model. To make sure the data is accurate and trustworthy, this phase may entail sorting and cleansing it.
Dashboard Design and Development:
With the data integrated, the next step is designing and developing the Power BI dashboard. This involves creating visualizations for the identified metrics and KPIs. The design should be clear, easy to use, and provide actionable insights. The dashboard should be user-friendly, allowing users to easily navigate and understand the data. Customization based on user roles and preferences may also make the dashboard more relevant and effective.
Testing and Deployment:
The Power BI dashboard undergoes a rigorous testing process in the last phase to make sure it satisfies the required business requirements. This procedure entails checking the quality of the data, making sure the visualizations appropriately depict the data, and making sure the dashboard functions properly in a range of situations. Following a successful testing phase, the dashboard is made available for corporate usage. At this stage, user support and training may also be provided to guarantee a seamless transition and efficient usage of the Power BI solution.
Better Decision-Making
The comprehensive and transparent perspective of supply chain activities provided by Power BI facilitates better decision-making by which businesses can make more informed decisions by merging and evaluating data from many sources. This data-driven approach may generate revenue, reduce expenses, and improve efficiency.
Improved Visibility
Having visibility is essential to supply chain management. Bottlenecks and inefficiencies can be found, and all supply chain activities can be clearly and comprehensively viewed with Power BI. To track shipment statuses in real time, for example, you can set up a dashboard that provides insightful information about distribution and logistics.
Better forecasting
Power BI’s sophisticated analytics features enable effective forecasting, crucial for inventory management and demand planning. Using an inventory dashboard by Power BI, precise forecasts can be generated from historical data. This capability enhances company planning by reducing surplus inventory and preventing stockouts, ultimately leading to higher customer satisfaction and savings on storage expenses.
Prompt Risk Assessment
The capacity of Power BI to recognize and reduce hazards before they become significant issues is one of its main advantages. Power BI’s robust data integration capabilities and real-time analytics enable early issue discovery. Power BI, for instance, can keep an eye on supplier performance and notify companies of any potential disruptions to the supply chain.
Importance of partnering with a Microsoft Power BI partner

Collaborating with a Microsoft Power BI partner can be transformative for businesses aiming to harness data analytics for informed decision-making and strategic planning. Here’s why this partnership is so vital:
Expertise and Experience:
Microsoft Power BI partners bring extensive knowledge and experience to the table. With a deep understanding of Power BI and its capabilities, these experts have worked with various businesses across different industries. Their experience enables them to customize Power BI solutions to meet each business’s unique needs, ensuring optimal results.
Access to Resources:
Being official Microsoft partners grants these consultants access to many resources and support from Microsoft. This encompasses the latest updates and features of Power BI, comprehensive training materials, and technical assistance. These resources guarantee that the Power BI solution stays up-to-date and operates optimally, consistently delivering significant value.
Training and Support:
Microsoft Power BI partners offer thorough training to help businesses maximize their use of Power BI. They provide ongoing support to address any issues that arise, ensuring the Power BI solution consistently delivers value. This support helps businesses stay adept at using the tool and adapting to any updates or changes.
Efficiency in Time and Costs:
Deploying a Power BI solution is often intricate and time intensive. Engaging a Microsoft Power BI implementation partner streamlines this process, conserving valuable time and resources for businesses. Their expertise mitigates costly mistakes and ensures a precise implementation from the outset, optimizing efficiency and effectiveness.
Strategic Direction:
Microsoft Power BI partners provide more than technical support; they offer strategic counsel. They assist businesses in leveraging Power BI for strategic decision-making, converting raw data into actionable insights. This guidance facilitates business expansion and enhances overall strategic planning capabilities.


QServices – Editorial Team
Our Articles are a precise collection of research and work done throughout our projects as well as our expert Foresight for the upcoming Changes in the IT Industry. We are a premier software and mobile application development firm, catering specifically to small and medium-sized businesses (SMBs). As a Microsoft Certified company, we offer a suite of services encompassing Software and Mobile Application Development, Microsoft Azure, Dynamics 365 CRM, and Microsoft PowerAutomate. Our team, comprising 90 skilled professionals, is dedicated to driving digital and app innovation, ensuring our clients receive top-tier, tailor-made solutions that align with their unique business needs.

In this blog, we’ll explore how AI-driven automation is reshaping banking. From boosting operational efficiency to improving compliance and risk management, we’ll look at how this technology is creating smarter, more adaptive financial systems.

Though the financial industry has evolved greatly from its days of relying heavily on paper records, are your finance team’s outdated procedures still causing problems? Although the term “digitization” has been around for a while, the main problem nowadays is updating outdated systems to handle the demands of a data-driven, fast-paced environment.

The financial services industry is at a major turning point, driven by rapid digital innovation. Banks and financial institutions are increasingly adopting cloud solutions, not just to save costs, but as a key component of new service delivery models. The cloud’s agility, scalability, and security help banks meet the evolving needs of customers and regulators.


Sahil Kataria
Founder and CEO

Amit Kumar
Chief Sales Officer


QServices Inc. undertakes every project with a high degree of professionalism. Their communication style is unmatched and they are always available to resolve issues or just discuss the project.
